Type 2 Diabetes Statistics: Key Data and Insights in 2025


Type 2 diabetes is one of the most common global health crises, which affects millions of people. In the United States alone, the number of individuals living with diabetes continues to rise, so it is important to stay informed about the latest statistics and trends.
We’ve collected the most important type 2 diabetes statistics, including global prevalence, demographics, survival rates, mortality trends, and treatment insights. This in-depth analysis provides a data-driven perspective on the current state of type 2 diabetes.
We have sourced our data from globally respected organizations such as the Centers for Disease Control and Prevention (CDC), World Health Organization (WHO), International Diabetes Federation (IDF), and peer-reviewed medical journals, to ensure accuracy and reliability. Our research methodology adheres to the highest standards, incorporating epidemiological studies, national health surveys, and medical registries to provide a transparent, evidence-based analysis.
Reviewed by healthcare professionals and supported by the latest clinical findings, this article presents up-to-date, ethically gathered insights while recognizing potential limitations such as data lag, reporting discrepancies, and regional healthcare inequalities.
As new studies and reports become available, we are committed to regularly updating this page, ensuring that readers stay informed about key type 2 diabetes trends in the United States and worldwide.
Key Type 2 Diabetes Statistics Worldwide
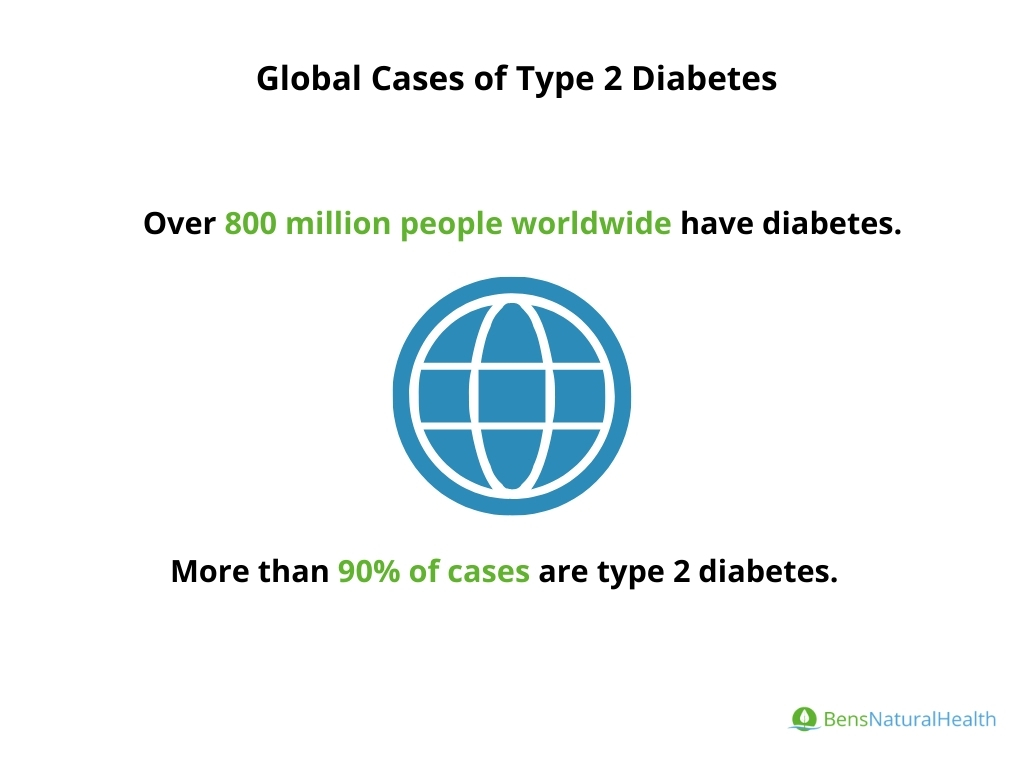
- Global Cases: Over 800 million people worldwide have diabetes. More than 90% of cases are type 2 diabetes, largely driven by lifestyle and aging populations.
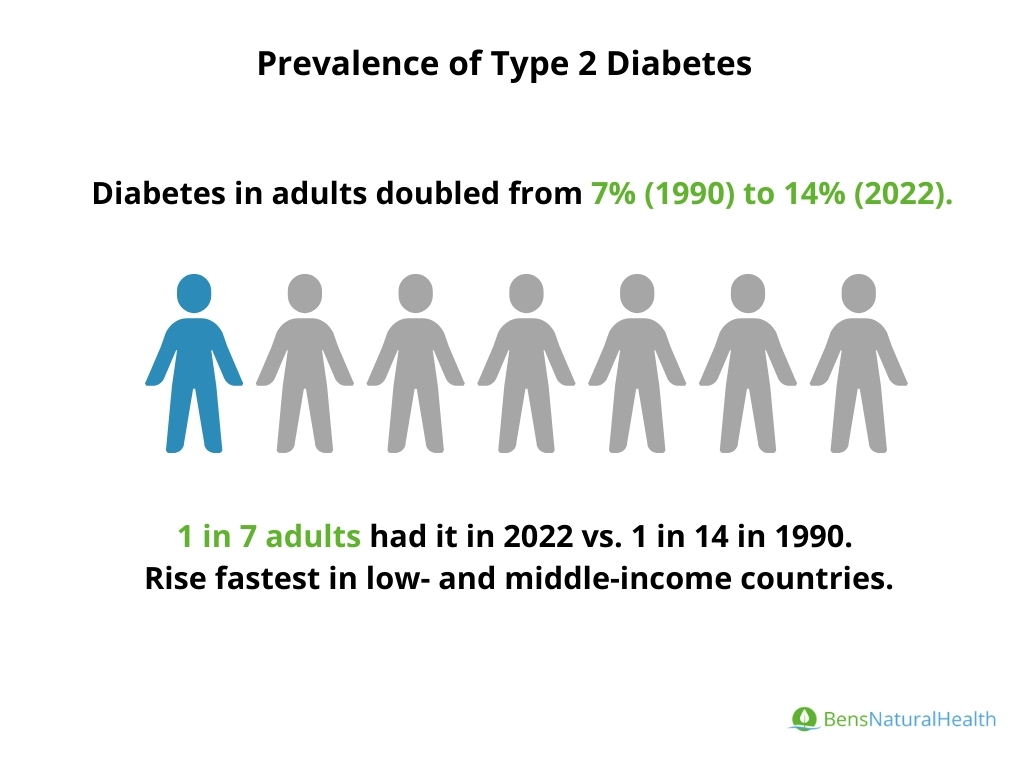
- Prevalence: Diabetes in adults doubled from 7% in 1990 to 14% in 2022. In 2022, 1 in 7 adults had diabetes, compared to 1 in 14 in 1990. The rise has been fastest in low- and middle-income countries.
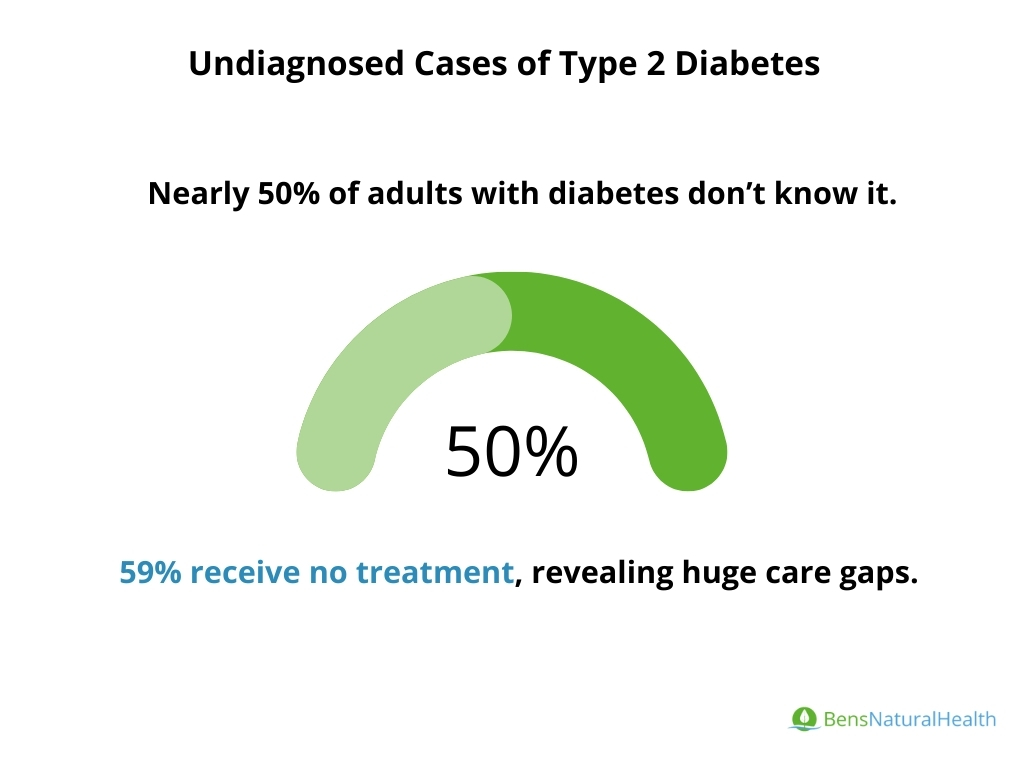
- Undiagnosed Cases: Nearly 50% of adults with diabetes don’t know they have it. Due to slow onset and mild early symptoms, many cases go untreated. Around 59% of adults with diabetes globally were not receiving treatment, exposing major healthcare gaps.
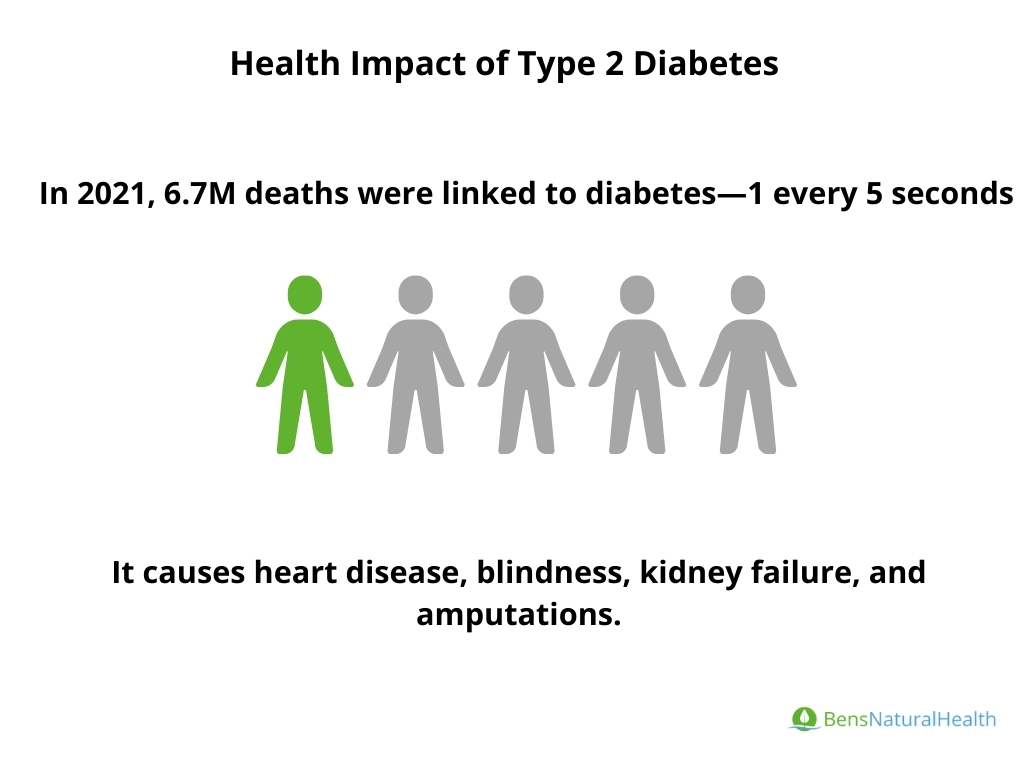
- Health Impact: Diabetes is a leading cause of death. In 2021, 6.7 million people died from diabetes (one death every 5 seconds). It contributes to heart disease, blindness, kidney failure, and amputations. In the U.S., diabetes was the 8th leading cause of death in 2021, with over 100,000 deaths directly linked to it.
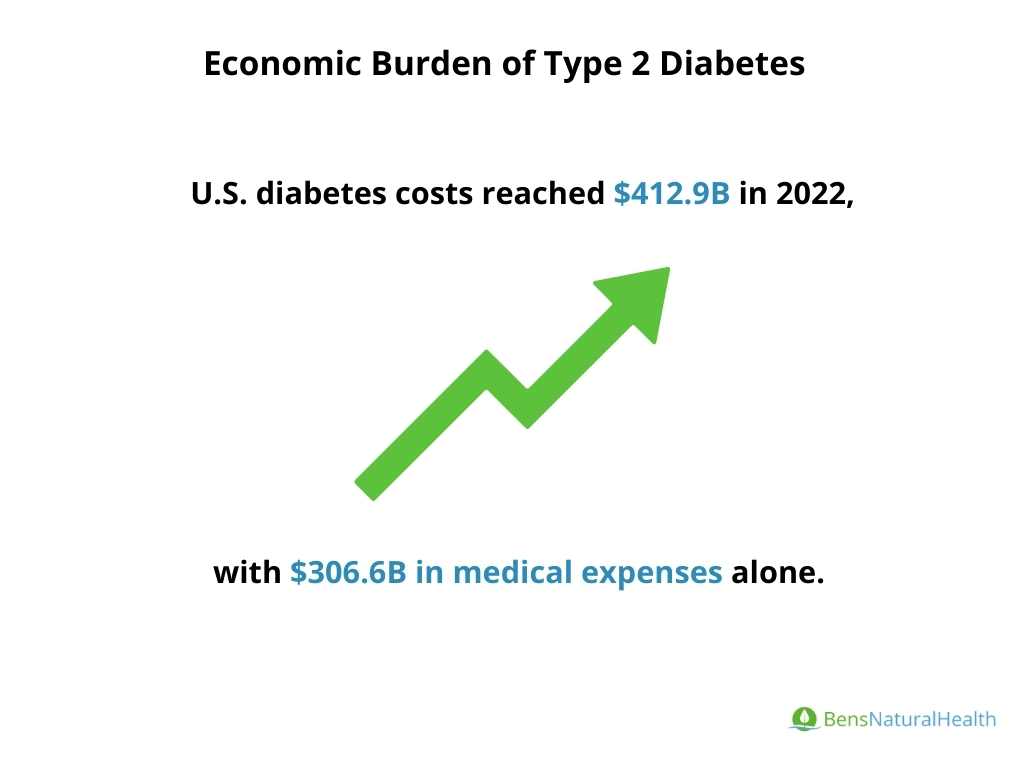
- Economic Burden: The cost of diabetes is massive. In the U.S., diabetes-related medical costs hit $306.6 billion in 2022, while total costs, including lost productivity, reached $412.9 billion.
Prevalence of Type 2 Diabetes
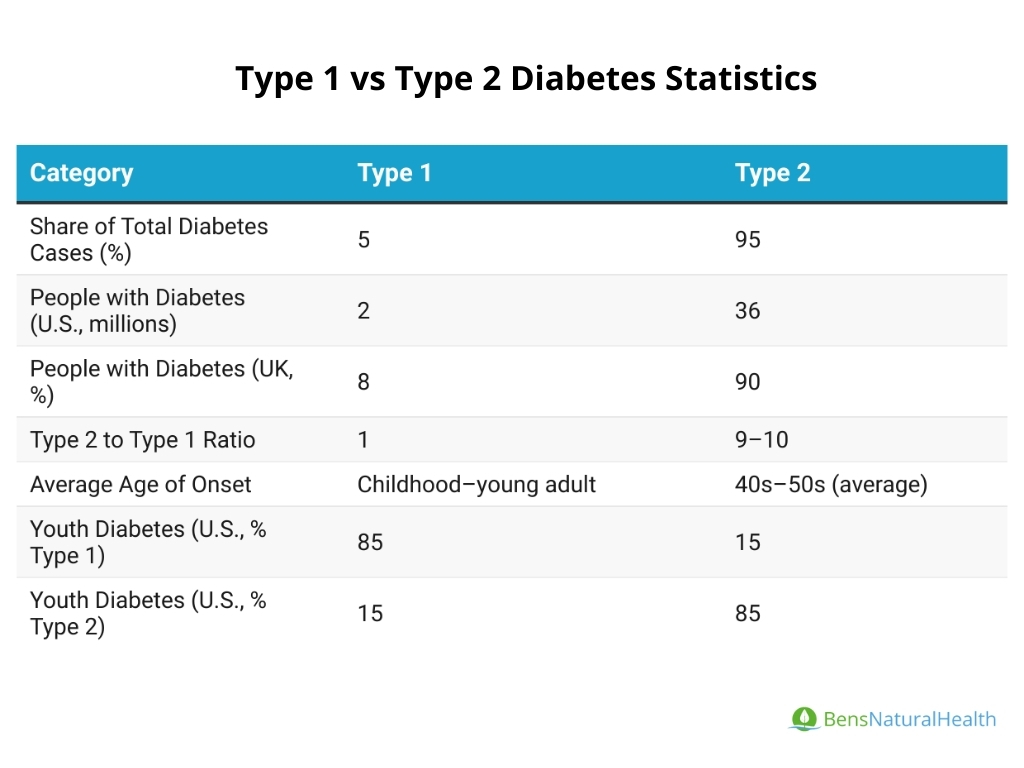
- Proportion of Diabetes Cases: Approximately 90–95% of all diabetes patients have type 2 diabetes.
- Type 1 diabetes and other types (like gestational or genetic forms) make up only 5–10%. For example, in the UK about 90% of people with diabetes have type 2, and in the U.S. the figure is similarly high (over 90%).
- Hereditary Risk: Having a family history markedly increases one’s chances of developing type 2. If one parent has type 2 diabetes, a person’s risk is around 40%; if both parents have it, the risk can be as high as 70%.
Prevalence of Type 2 Diabetes Worldwide
- Global Prevalence: As of 2021, an estimated 10.5% of the world’s adult population (20–79 years) had diabetes (most of them type 2). By 2023, updated analyses suggest over 14% of adults have diabetes. The total number of people (of all ages) with diabetes is around 830 million in 2025 (including diagnosed and undiagnosed cases). This is a dramatic rise from previous decades – for context, about 463 million adults had diabetes in 2019, so the number has nearly doubled in a few decades.
- Regional Differences: Diabetes prevalence is highest in regions like the Middle East, North Africa, and the Pacific Islands, and lower in regions like sub-Saharan Africa (for now). For example, many Middle Eastern countries have adult diabetes rates well above 15%, whereas many African countries are still in the single digits. Approximately 3 in 4 adults with diabetes live in low- and middle-income countries, where rapid urbanization and lifestyle changes have led to surging type 2 diabetes rates.
- Undiagnosed Worldwide: Globally, about 45%–50% of diabetes cases are undiagnosed. In lower-income regions, this proportion is even higher. The IDF African region has the highest fraction of undiagnosed diabetes – an estimated 54% of cases are not aware of their condition. This means millions of people globally have type 2 diabetes but are not receiving treatment, which increases the risk of complications.
Type 2 Diabetes Prevalence by Country Statistics
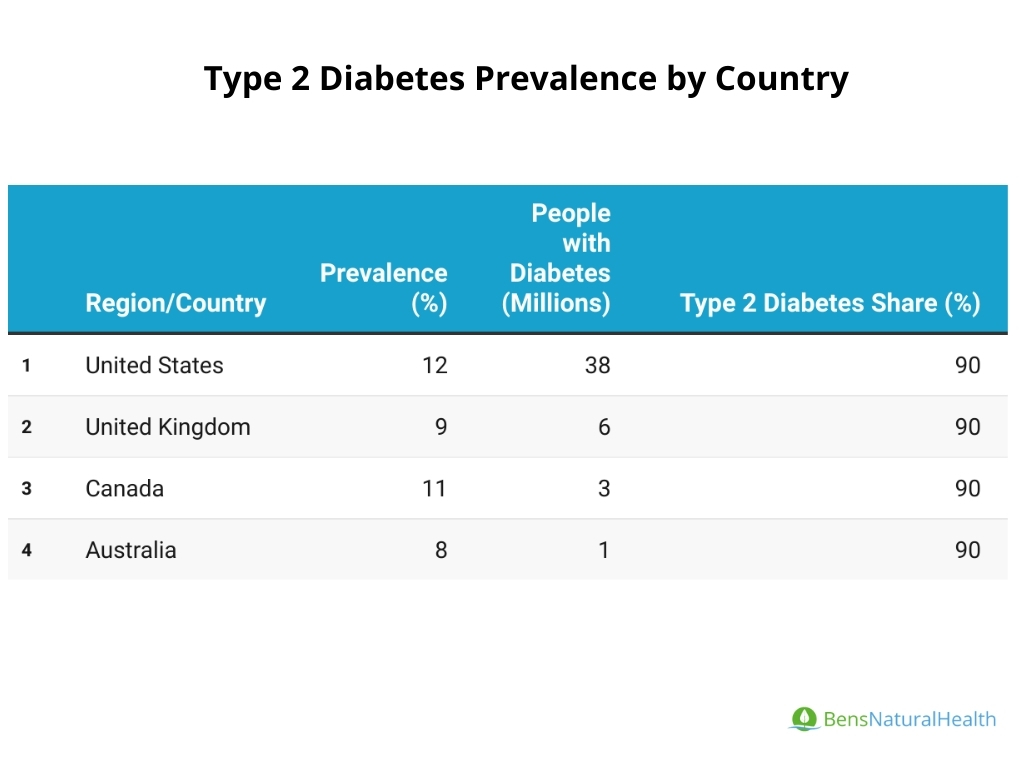
- United States: About 11.6% of the U.S. population had diabetes as of 2021. This equates to 38.4 million Americans living with diabetes. Over 90% of these cases are type 2, meaning roughly 34–35 million Americans have type 2 diabetes. Prevalence rises sharply with age – more than 29% of Americans over 65 have diabetes (nearly one in three seniors). The U.S. also has a large undiagnosed population: roughly 23% of adults with diabetes are undiagnosed.
- United Kingdom: Over 5.8 million people in the UK are estimated to have diabetes (diagnosed or undiagnosed), an all-time high. This is around 8.5% of the UK population. Of these, ~4.6 million are diagnosed and about 1.3 million are undiagnosed type 2 cases. Approximately 90% of UK diabetes cases are type 2. The UK has seen a steady rise; for example, registered diabetes cases increased by 185,000 from 2022 to 2023.
- Canada: In Canada, about 10.5% of adults have diabetes (2021 data), which equates to approximately 3.0 million people with diabetes. Canada’s prevalence is similar to other high-income countries’ averages. Type 2 accounts for the vast majority of these cases. Indigenous populations in Canada have considerably higher rates than the national average, mirroring patterns seen in the U.S. (Native Americans) and Australia (Aboriginal peoples).
- Australia: Australia’s adult diabetes prevalence is 8.2%, with roughly 1.49 million Australians affected. Like other developed countries, Australia has seen diabetes rates climb over time. A significant portion of the Australian diabetes population is undiagnosed or in early stages (prediabetes). Efforts in public health focus on lifestyle interventions to curb this rise.
- Hispanic/Latino Population (U.S.): Prevalence is higher in Latino populations compared to non-Hispanic whites. In the United States, 11.7% of Hispanic adults have diagnosed diabetes, compared to 6.9% of white adults.
- Africa (Overall): Africa currently has a lower overall diabetes prevalence (~4-5% of adults) but is rapidly increasing. The IDF estimates 24 million adults in Africa had diabetes in 2021, and projects this will surge by 129% to 55 million by 2045 if current trends continue. Factors include urbanization, changes in diet and physical activity, and aging populations. It’s important to note that awareness is low: over half of diabetes cases in Africa are undiagnosed.
Type 1 vs Type 2 Diabetes Statistics
Type 1 and type 2 diabetes differ in etiology and typical patient profile. Here we compare their prevalence and other statistical differences:
- Prevalence and Proportion: 90-95% of all diabetes cases are type 2, while type 1 diabetes accounts for only ~5-10%. For example, out of the 38 million Americans with diabetes, about 2 million have type 1, and the rest (36 million) have type 2. In the UK, roughly 8% have type 1 and 90% type 2. Type 1 diabetes remains far less common.
- Age of Onset: Type 1 diabetes often presents in childhood or young adulthood, whereas type 2 diabetes typically develops in adulthood (though this is changing as we’ll see). The average age of diagnosis for type 2 has historically been in the 40s-50s.
Type 1 vs Type 2 Diabetes Prevalence
To put it plainly: for every person with type 1 diabetes, there are about 9 to 10 people with type 2 diabetes.
However, in youth populations, type 1 is still more common – for example, among American youth under 20 with diabetes, about 85–90% have type 1 and 10–15% have type 2. But as obesity rises in children, type 2 is making inroads even in that group.
Type 2 Diabetes Ethnicity Statistics
- In the United States, the prevalence of diagnosed diabetes in adults is highest among Native Americans/Alaska Natives (13.6%), followed by non-Hispanic Black Americans (12.1%) and Hispanics (11.7%), compared to about 7% in non-Hispanic whites.
- Non-Hispanic Black adults are almost twice as likely to have diabetes as non-Hispanic White adults (12.1% vs 6.9%).
- Hispanic Americans overall are about 1.7 times as likely as whites to have diabetes, with variations by subgroup (e.g., Puerto Ricans have higher rates than South Americans, as noted earlier). Asian Americans have an intermediate prevalence (~9%), but certain Asian subgroups (South Asians and Pacific Islanders) have very high susceptibility.
- In the United Kingdom, a similar pattern is observed: people of South Asian, African, or Caribbean descent are 2 to 4 times more likely to develop type 2 diabetes than those of European (white) descent.
- Globally, South Asian, Middle Eastern, and African ancestry populations have elevated risks. For example, India has over 74 million people with diabetes (second only to China), largely in South Asian ethnic groups.
Type 2 Diabetes African American Statistics
- Prevalence: As noted, about 12.1% of non-Hispanic Black adults in the U.S. have diagnosed diabetes, versus 6.9% of non-Hispanic White adults. After adjusting for age, Black Americans are about 1.4 times more likely to have diabetes than White Americans. This gap has persisted over decades.
- Earlier Onset: African Americans often develop type 2 diabetes at younger ages. Research shows higher incidence in the 30s-50s age range compared to whites. There is also a higher rate of gestational diabetes in Black women, which predisposes them to type 2 diabetes after pregnancy.
- Complications and Outcomes: Unfortunately, African Americans experience higher rates of diabetes complications. They are 40% more likely to die from diabetes than white Americans. They also have higher rates of diabetes-related blindness, kidney failure (end-stage renal disease), and amputations.
Type 2 Diabetes Gender Statistics
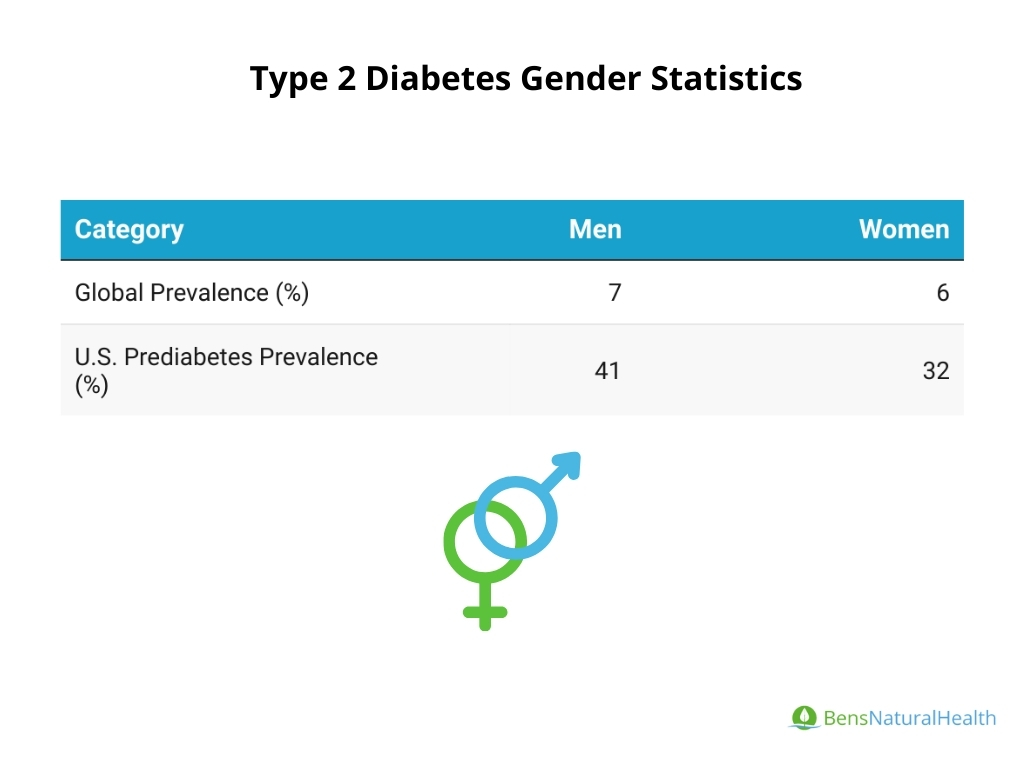
Does type 2 diabetes affect men and women differently? In terms of prevalence men are impacted slightly more. Key gender-related statistics:
- Prevalence by Sex: A recent global analysis found an age-adjusted diabetes prevalence of 6.5% in males vs 5.8% in females. In the U.S., men also have a slightly higher prevalence of diagnosed diabetes.
- Undiagnosed and Prediabetes: In the U.S., about 41% of men and 32% of women had prediabetes in recent surveys – indicating men have a higher burden of early glycemic abnormalities as well.
- Diabetes in Pregnancy: Only women experience gestational diabetes (GDM), which is a strong risk factor for later type 2. About 50% of women with GDM will develop type 2 within 5–10 years. This contributes to the pool of type 2 diabetes in women of mid-life.
Type 2 Diabetes Statistics by Age Groups
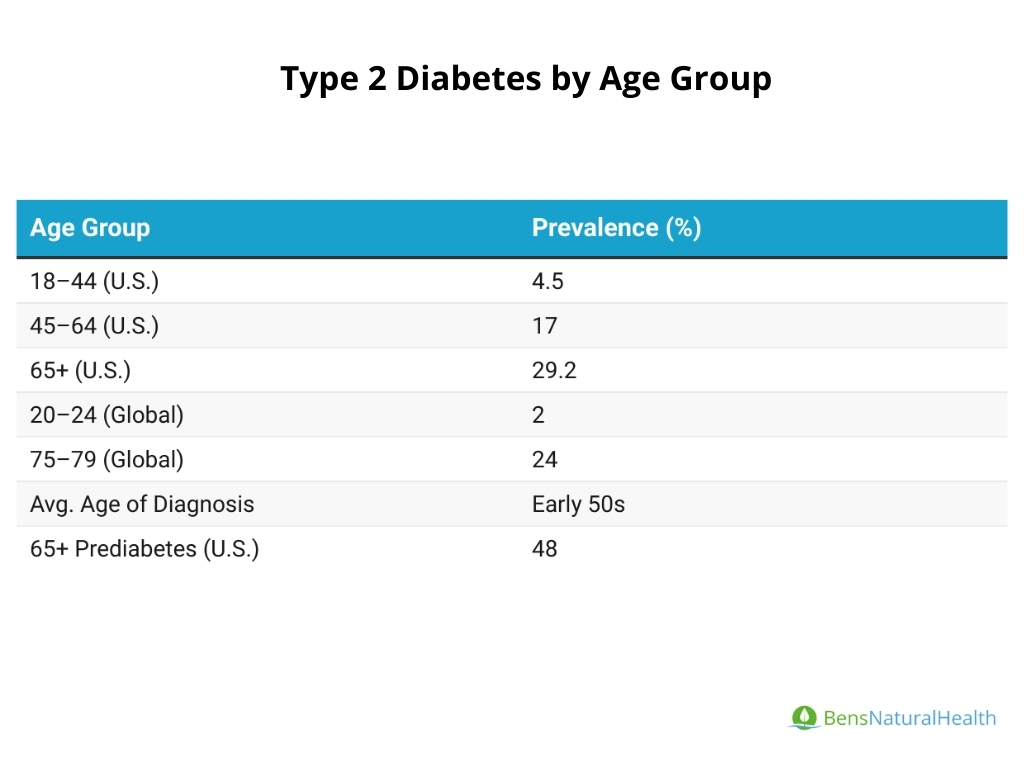
- Middle-Aged and Older Adults: Type 2 diabetes is most common in middle-aged and senior adults. In the United States, over 1 in 4 people aged 65 or older have diabetes – about 29.2%. This is the highest prevalence of any age bracket.
- In the 45–64 age group, U.S. prevalence is around 17% (nearly 1 in 6).
- By contrast, among young adults (18–44), it’s only about 4-5%.
- Similarly, globally the prevalence climbs with age: it is lowest (~2% or less) in 20–24 year-olds and peaks in the elderly. For example, among adults aged 75–79 worldwide, diabetes prevalence is estimated to be around 24%.
- Average Age of Diagnosis: The average age of diagnosis for type 2 diabetes is in the early 50s in many developed countries. However, this average has been trending younger.
- Seniors and Prediabetes: A very large proportion of seniors have prediabetes (impaired glucose tolerance), which puts them at high risk. In the U.S., about 48% of adults over 65 have prediabetes.
Type 2 Diabetes in Youth Statistics
- Prevalence in Youth: It’s estimated that about 352,000 Americans under age 20 have diabetes (of all types), which is roughly 0.35% of the under-20 population. The majority of these are type 1 diabetes. Type 2 diabetes in youth still accounts for a minority of cases, but that minority is growing. As of 2017-2018 data, about 5,300 youth per year were being diagnosed with type 2 diabetes in the U.S., compared to ~18,200 per year with type 1. So roughly 1 in 5 new diabetes diagnoses in youth were type 2.
- Trends: The incidence of type 2 diabetes in youth has been increasing rapidly. A longitudinal study in the U.S. (SEARCH for Diabetes in Youth) found a significant upward trend in type 2 cases among adolescents between 2002 and 2015 (around a 4-5% annual increase). More recently, the COVID-19 pandemic may have accelerated this – one report found a 62% jump in new-onset type 2 diabetes among youth after the pandemic began (possibly due to weight gain and delayed medical care). While that figure needs longer-term confirmation, it spotlights the concerning trajectory.
- Demographics: Youth type 2 diabetes disproportionately affects minority groups. In the U.S., it’s seen most in Indigenous, African American, Hispanic, and Asian/Pacific Islander youth – mirroring adult disparities.
- Obesity Link: Obesity is by far the biggest risk factor in youth-onset type 2 diabetes. Approximately 75% of children and adolescents with type 2 diabetes have obesity (a body mass index of 30 or higher), and almost all the rest are overweight.
Type 2 Diabetes Diagnosis Statistics
- Undiagnosed Cases: Globally, roughly 50% of people with type 2 diabetes are undiagnosed. They have the condition but have not been formally diagnosed by a health professional. In 2019, the International Diabetes Federation estimated about 240 million people worldwide have undiagnosed diabetes
- United States Undiagnosed: In the U.S., with widespread screening, the proportion undiagnosed is lower but still significant. An estimated 23% of Americans with diabetes are undiagnosed – that was about 8.5 million people undiagnosed (out of 37 million total) in 2019.
- Prediabetes Diagnosis: Prediabetes (elevated blood sugar not yet in diabetes range) often precedes type 2 diabetes. It’s very common – about 96 million U.S. adults (38%) have prediabetes. Programs like the CDC’s Diabetes Prevention Program have had success in lowering risk among those diagnosed with prediabetes.
- Delay in Diagnosis: It’s estimated that some individuals with type 2 diabetes can have it for 5–7 years before diagnosis. During this time, high blood sugar quietly damages organs. In fact, about 1 in 5 people with type 2 diabetes already have some diabetic retinopathy (eye damage) by the time of first diagnosis.
Type 2 Diabetes Symptoms Statistics
Key symptoms of type 2 diabetes include: frequent urination (polyuria), excessive thirst (polydipsia), increased hunger, fatigue, blurred vision, slow-healing wounds, and numbness or tingling in hands/feet. However, quantifying “symptom statistics” is tricky because not everyone has noticeable symptoms, and people report them differently. Some relevant points:
- Women: Women with type 2 diabetes may experience urinary tract infections (UTIs) and yeast infections. Elevated blood glucose can create an environment that fosters yeast growth and impairs immune response. Additionally, sexual dysfunction in women (like low libido or vaginal dryness) is common – one study found over 78% of women with type 2 diabetes had some type of sexual dysfunction. Hormonal factors and blood vessel changes due to diabetes can contribute to these issues.
- Men: Men with type 2 diabetes often deal with erectile dysfunction (ED) as a symptom or complication. Consistently high blood sugar damages blood vessels and nerves needed for normal erections. Men with diabetes are about 3 times more likely to experience ED than men without diabetes. Studies show ED is very prevalent among diabetic men – estimates suggest around half of men with type 2 diabetes have some degree of erectile dysfunction.
In terms of statistics: a U.K. study found that about 44% of people with type 2 diabetes had no notable symptoms at diagnosis, 42% had some symptoms but didn’t necessarily realize, and only ~15% had the classic triad of polyuria, polydipsia, weight loss. This shows why routine screening is vital. Once blood sugars run very high (say, HbA1c >9% or glucose >250 mg/dL), most people will experience at least some symptoms.
Symptoms of Type 2 Diabetes in Women
Women with type 2 diabetes experience the general symptoms of high blood sugar (fatigue, thirst, frequent urination) but also face some gender-specific issues:
- Polycystic Ovary Syndrome (PCOS): PCOS is a condition in women characterized by ovarian cysts, irregular periods, and often insulin resistance. About 10% of PCOS patients develop diabetes by age 40.
- Sexual Dysfunction: As mentioned, a high percentage of women with type 2 diabetes experience sexual health issues. In one study, 78% of women with type 2 reported sexual dysfunction (low libido, arousal difficulties, lubrication issues, or satisfaction issues).
Type 2 Diabetes Symptoms in Men
- Erectile Dysfunction (ED): This is one of the most prevalent issues for men with diabetes. Diabetes is a leading cause of ED. Research indicates that the prevalence of erectile dysfunction in men with diabetes is around 50% (varies by age and duration of diabetes).
- Low Testosterone: Men with type 2 diabetes have higher rates of low testosterone (hypogonadism). Approximately 30-50% of men with type 2 may have below-normal testosterone levels.
Symptoms of Type 2 Diabetes in Children
- Weight and Physical Signs: The majority of youth with type 2 are overweight/obese (about 75% obese). Many exhibit acanthosis nigricans, which appears as darkened, velvety patches of skin in body folds (like the neck or armpits).
Obesity and Type 2 Diabetes Statistics
It is often said that obesity and type 2 diabetes go hand in hand. The statistical link between excess weight and type 2 diabetes is indeed very strong:
- An overwhelming majority of individuals with type 2 diabetes are overweight or obese. Studies indicate more than 90% of patients with type 2 diabetes have a body mass index (BMI) ≥25 (overweight or obese). In the U.S., one analysis found only about 12-13% of those with type 2 had a normal weight – the rest were above healthy weight ranges.
- In the U.S., adult obesity prevalence increased from ~15% in 1990 to 42% in 2020. During the same period, diabetes prevalence tripled.
- Clinical trials show that losing even 5-10% of body weight can significantly improve blood sugar control in type 2 diabetics, and larger weight loss (15% or more) can even induce remission of diabetes in many cases.
Type 2 Diabetes Treatment Statistics
- Common Medications: Metformin is by far the most commonly prescribed initial medication for type 2 diabetes worldwide. It’s affordable and effective. In the U.S., over 80% of patients start their diabetes treatment with metformin as the first-line drug. A study found that about 83% of privately insured patients and 81% of Medicare patients were initiated on metformin monotherapy as first-line therapy, reflecting clinical guidelines.
- Insulin therapy: In the U.S., about 20–30% of type 2 diabetes patients use insulin (either alone or in combination with oral medications). One analysis reported 21.6% of U.S. adults with type 2 were using insulin therapy by 2012; this likely includes those on insulin plus orals.
- Cost of Medications: The overall spending on diabetes drugs in the U.S. was around $85 billion in 2017, and rising (this is part of the direct medical cost). New GLP-1 agonists (some of which are injectable) can cost $500+ per month without insurance.
Type 2 Diabetes Medications Statistics
- Oral Medication Usage: A CDC report from 2010-2012 found that about 57% of U.S. adults with type 2 diabetes used oral medications only, 14% used insulin with or without oral meds, and the rest managed by diet alone.
- Metformin Prevalence: It’s estimated that over 90% of U.S. type 2 diabetics who are on medication have metformin as part of their regimen at some point. In many other countries, metformin is also the most prescribed diabetes drug.
- New Drug Adoption: By 2025, newer drug classes have gained ground. For example, prescription data show that around 20-30% of type 2 diabetes patients in the U.S. have been prescribed a GLP-1 receptor agonist (like liraglutide or semaglutide) or an SGLT2 inhibitor (like empagliflozin) in addition to or instead of older drugs.
- Cost Statistics: The American Diabetes Association’s cost analysis (2022) found that of the $306 billion in direct medical costs for diabetes, about $73 billion was spent on anti-diabetic medications and diabetic supplies. This includes insulin, oral drugs, and devices (glucose monitors, test strips).
- Insulin is a major contributor; for instance, the average annual insulin expenditure per user in the U.S. was estimated around $5,900 in 2017 (total, not out-of-pocket necessarily).
- Oral drugs like metformin are cheap ($4 generics), but newer drugs can cost $300-$600 per month. Many patients struggle with these costs, and medication non-adherence is often linked to cost.
- Some 2021 data indicated that about 1 in 4 insulin users in the U.S. were reported to have rationed insulin due to cost – a dangerous practice. Efforts like co-pay caps ($35 insulin cap under some Medicare plans in 2023) are aimed at improving this.
- Medication Outcomes: Rates of diabetes complications such as amputations, kidney failure, and blindness have declined substantially (by 20-60%) over the past two decades in the U.S., partly due to better medications and risk factor control.
Type 2 Diabetes Survival Rate Statistics
- Type 2 diabetes, especially if diagnosed at a younger age, can reduce life expectancy. A comprehensive study indicated that a 30-year-old diagnosed with type 2 diabetes may lose about 14 years of life expectancy on average if they have suboptimal control. Even with better management, there is some reduction. For a more typical case, a person diagnosed in their 40s or 50s might lose roughly 5–6 years of life to diabetes on average.
- Mortality rates for people with diabetes have improved over time. In the U.S., one study found that between 1997 and 2006, the all-cause mortality rate among diabetics declined significantly (about a 23% drop), reflecting better care. In other words, survival rates for diabetic patients have been improving.
The concept of “survival rate” for diabetes is complex, but broadly, about 2 out of 3 people with type 2 diabetes will die from a cardiovascular cause (heart attack or stroke), often earlier than they might have without diabetes.
Covid and Diabetes Type 2 Survival Rate Statistics
- Infection Severity: Having diabetes (type 1 or 2) approximately doubles the risk of severe illness when infected with SARS-CoV-2. In particular, individuals with diabetes were far more likely to require hospitalization and intensive care when they got COVID-19.
- Mortality Risk: A meta-analysis of studies worldwide found that COVID-19 patients with diabetes had a mortality risk about 2 to 3 times higher than patients without diabetes. One cohort study in England showed a hazard ratio of 1.23 (23% increased risk) for diabetic ICU patients vs non-diabetic, after some adjustments, but many other studies (especially unadjusted for age) showed larger increases. Much depends on co-factors like age, obesity, and hypertension, which often accompany diabetes.
- Proportion of Deaths: A striking statistic from the U.S. CDC: nearly 40% of people who died in hospitals from COVID-19 had diabetes. Specifically, among patients hospitalized for COVID with severe outcomes, 46.5% of those who died had diabetes.
Type 2 Diabetes Mortality Rate Statistics
- Global Mortality: Diabetes (mostly type 2) was responsible for 6.7 million deaths in 2021, accounting for 11% of adult deaths worldwide.
- Mortality Ranking: Diabetes is the #9 cause of death globally but ranks even higher in many middle-income countries. In the U.S., it’s the 8th leading cause of death, though this is likely underestimated since related deaths (e.g., heart disease) are often listed instead. In 2021, diabetes was the primary cause in ~103,000 U.S. deaths but appeared on 399,000 death certificates, showing its broader impact.
- Mortality Rate: In the U.S., the diabetes death rate was 30.4 per 100,000 in 2022.
Complication-Specific Mortality:
- Cardiovascular disease (CVD) is the #1 cause of death in diabetics, responsible for 50-60% of deaths (heart attacks, heart failure, strokes).
- Kidney failure is another major cause; diabetes is the leading cause of end-stage renal disease, and dialysis patients face a 20% annual mortality rate.
- Acute diabetes crises like diabetic ketoacidosis and severe hypoglycemia can cause death but are rarer in type 2.
- Life Expectancy Impact: A 55-year-old man with type 2 diabetes has an average life expectancy of 13 more years, while a non-diabetic counterpart may live 20+ years. However, well-managed diabetes (A1c <7%, BP <130/80, controlled cholesterol, no smoking) significantly reduces mortality risk.
Type 2 Diabetes Covid Death Rate Statistics
- Case Fatality Rates: Prior to vaccines, the case fatality rate of COVID-19 was significantly higher in diabetic patients. For hospitalized COVID patients, published data showed a fatality rate of around 20-30% for those with diabetes, versus about 10-15% in those without, as mentioned. In ICU settings, one study found diabetic status independently raised death risk by ~23%, but unadjusted differences were larger.
- Proportion of Covid Deaths with Diabetes: Many countries reported around 1/3 to 1/2 of all COVID-19 deaths occurred in people with diabetes (often type 2 given age). For example, in the CDC data: among COVID patients hospitalized with severe outcomes, 39.7% had diabetes; among those who died in hospital, 46.5% had diabetes. This indicates nearly half of COVID deaths in hospitals were in patients with diabetes. In the UK, a report from NHS found that people with diabetes accounted for 32% of COVID deaths in hospitals early in the pandemic.
Future Predictions for Type 2 Diabetes
- Global Predictions: The International Diabetes Federation (IDF) projects that the number of people with diabetes will reach 643 million by 2030 and 783 million by 2045. These are updates based on the 2021 estimates of 537 million. However, newer analyses suggest those figures might even be conservative.
- A 2023 study from the Global Burden of Disease collaboration in The Lancet predicted that if current trends persist, the global diabetes population (all types) could soar to 1.3 billion by 2050. Regions like North Africa, the Middle East, and the Pacific Islands are expected to be hardest hit – some countries might see 1 in 5 adults living with diabetes by 2050 if nothing changes, and in older age groups possibly 1 in 3.
- U.S. Predictions: In the United States, earlier CDC models projected that as many as 1 in 3 adults could have diabetes by 2050 if trends continued unabated. This oft-cited prediction (released in 2010 by CDC) highlights the potential magnitude: it would mean around 100 million diabetics in the U.S. by 2050.
- More near-term, the CDC’s National Diabetes Statistics Report hasn’t given explicit 2030 forecasts, but other researchers have. One study (Boyle et al. “Diabetes 2030”) projected that 54.9 million Americans will have diabetes by 2030, up from ~37 million in 2019. That would be roughly 15% of the population.
- Economic and Healthcare Planning: Both globally and in the U.S., health planners are preparing for a growing diabetic population. This means more demand for endocrinologists, diabetes educators, and supplies (like insulin). The annual global cost of diabetes, which was about $966 billion in 2021, will likely climb to trillions in coming decades. There is urgent emphasis on prevention to mitigate these outcomes.
In summary, if current trends hold, type 2 diabetes will continue to expand in prevalence through 2030 and beyond, affecting hundreds of millions more people worldwide. Global cases could exceed 1 billion by mid-century if aggressive action isn’t taken.
Global Predictions for Type 2 Diabetes
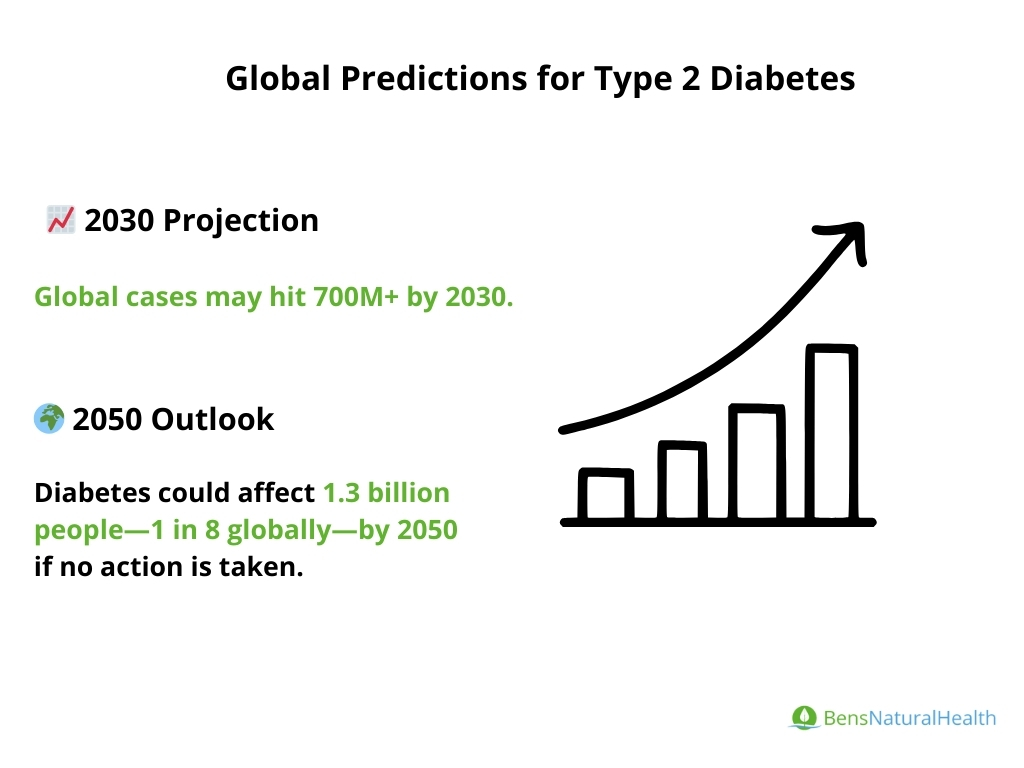
- 800+ Million by 2030: IDF predicts 643 million by 2030, but given current overshoots, it wouldn’t be surprising if we approach or exceed 700 million by 2030. By 2030, China, India, and Pakistan alone may account for over 250 million diabetics combined. Africa will likely exceed 50 million. The Middle East & North Africa region may see close to 100 million by 2030.
- 1.3 Billion by 2050: The Lancet study in 2023 grabs attention with 1.3 billion by 2050 if effective measures are not implemented. That equates to roughly 1 in 8 people on the planet having diabetes.
- Demographic Shift: By 2045, a greater proportion of diabetics will be in urban areas (as is already the case) and in the 65+ age group.
US Predictions for Type 2 Diabetes
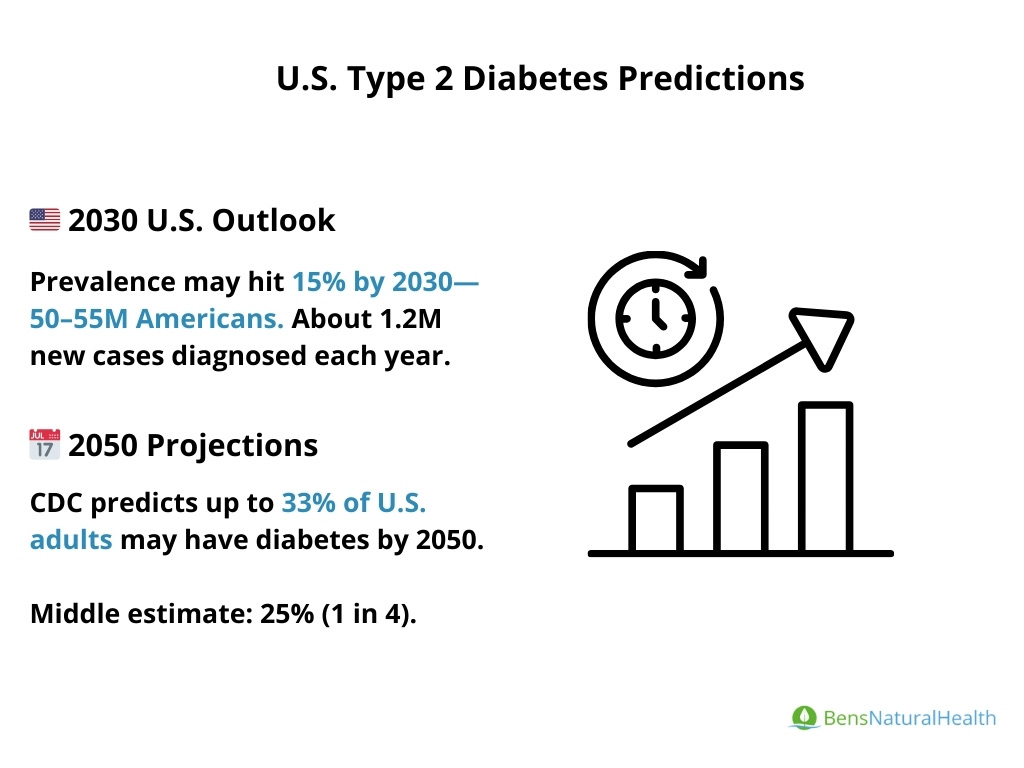
- Prevalence by 2030: Various estimates put the U.S. diabetes prevalence around 15% of the population by 2030 (up from ~11% today). In absolute terms, possibly 50–55 million Americans with diabetes by 2030. The CDC hasn’t officially published a 2030 number, but given 1.2 million new diagnoses per year currently, a rough addition of 10–15 million in the next decade seems plausible.
- Youth Surge: By 2030, we might also see more youth with type 2. A NIH modeling study predicted that the number of youths with type 2 could increase almost 4-fold by 2050 (from 28,000 in 2010 to ~130,000 in 2050).
- 2050 Outlook: The famous CDC analysis in 2010 gave a range of scenarios, with the worst case being 33% of U.S. adults with diabetes in 2050. Even a middle-ground scenario had about 25% by 2050. So somewhere between 1 in 4 and 1 in 3 adults.
- Prediabetes Conversion: The fate of the ~96 million Americans with prediabetes will heavily shape future numbers. There’s a concerted effort (National DPP programs, etc.) to reduce progression. If those efforts are modestly successful, maybe “only” a third will progress instead of half. But even that means millions of new cases.
- State Variations: Some states (especially in the South) could see extremely high diabetes rates. For instance, states like Mississippi and West Virginia have adult diabetes rates around 15%. By 2030, those might exceed 20%. In contrast, some states in the West or Northeast might remain around 10-12%. This disparity will continue to challenge a one-size-fits-all approach; local strategies will be important.
This article is for informational purposes only and does not serve as medical advice. The details provided here are not a replacement for, and should never be depended upon as, professional medical advice. Always consult your physician regarding the potential risks and benefits of any treatment.
Diana Gariglio-Clelland
Registered Dietitian (RD) and Certified Diabetes Care & Education Specialist (CDCES)
Diana Gariglio-Clelland, RD, CDCES, is a registered dietitian and certified diabetes care and education specialist with expertise in medical nutrition therapy, diabetes management, and weight-neutral nutrition counseling.
Our Medical Review Process
At Ben’s Natural Health, we are committed to maintaining the highest standards of accuracy, transparency, and scientific integrity. Every piece of content is carefully developed by medical professionals and undergoes a thorough review every 12 to 24 months. This ensures that our information remains current, reliable, and rooted in credible, evidence-based research. We reference only peer-reviewed studies from reputable medical journals, providing full citations and direct links to enhance trust and confidence. Learn more about our medical review process and research standards.
Our Editorial Guidelines
For over 25 years, Ben’s Natural Health has been a trusted source of scientifically backed, reliable health information. Our editorial guidelines uphold the highest quality and integrity for every article we publish. Each piece is written by qualified experts and undergoes independent quality checks. We prioritize transparency by clearly displaying contributor credentials and biographies at the beginning of every article. Read more about our editorial standards.
Medical Disclaimer
The content on this blog is for informational purposes only and should not be considered a substitute for professional medical advice, diagnosis, or treatment. While our articles are authored and reviewed by licensed medical professionals, they may not address your specific health concerns. Always consult a qualified healthcare provider before making any medical decisions.
Article Sources
- https://idf.org/news/new-diabetes-estimates
- https://www.who.int/health-topics/diabetes
- https://www.weforum.org/stories/2024/11/diabetes-silent-epidemic-world-health
- https://diabetes.org/about-diabetes/statistics/about-diabetes
- Parker ED, Lin J, Mahoney T, Ume N, Yang G, Gabbay RA, ElSayed NA, Bannuru RR. Economic Costs of Diabetes in the U.S. in 2022. Diabetes Care. 2024 Jan 1;47(1):26-43. doi: 10.2337/dci23-0085. PMID: 37909353.
- https://www.cdc.gov/diabetes/communication-resources/413-billion-diabetes-costs.html
- https://www.niddk.nih.gov/health-information/diabetes/overview/what-is-diabetes
- https://www.diabetes.org.uk/about-us/about-the-charity/our-strategy/statistics
- https://beyondtype1.org/is-type-2-diabetes-hereditary/
- Kautzky-Willer A, Leutner M, Harreiter J. Sex differences in type 2 diabetes. Diabetologia. 2023 Jun;66(6):986-1002. doi: 10.1007/s00125-023-05891-x. Epub 2023 Mar 10. Erratum in: Diabetologia. 2023 Jun;66(6):1165. doi: 10.1007/s00125-023-05913-8. PMID: 36897358; PMCID: PMC10163139.
- https://minorityhealth.hhs.gov/diabetes-and-blackafrican-americans
- GBD 2021 Diabetes Collaborators. Global, regional, and national burden of diabetes from 1990 to 2021, with projections of prevalence to 2050: a systematic analysis for the Global Burden of Disease Study 2021. Lancet. 2023 Jul 15;402(10397):203-234. doi: 10.1016/S0140-6736(23)01301-6. Epub 2023 Jun 22. Erratum in: Lancet. 2023 Sep 30;402(10408):1132. doi: 10.1016/S0140-6736(23)02044-5. Erratum in: Lancet. 2025 Jan 18;405(10474):202. doi: 10.1016/S0140-6736(25)00053-4. PMID: 37356446; PMCID: PMC10364581.
- https://www.cdc.gov/diabetes/php/data-research/index.html
- https://www.medicalnewstoday.com/articles/diabetes-affects-men-women
- Magliano DJ, Boyko EJ; IDF Diabetes Atlas 10th edition scientific committee . IDF DIABETES ATLAS [Internet]. 10th edition. Brussels: International Diabetes Federation; 2021. Chapter 3, Global picture. Available from: https://www.ncbi.nlm.nih.gov/books/NBK581940/
- https://www.cidrap.umn.edu/covid-19/type-2-diabetes-rates-us-youth-rose-62-after-covid-pandemic-began-study-suggests
- https://www.healthline.com/health-news/not-all-kids-with-type-2-diabetes-have-obesity-what-parents-need-to-know
- Kouidrat Y, Pizzol D, Cosco T, Thompson T, Carnaghi M, Bertoldo A, Solmi M, Stubbs B, Veronese N. High prevalence of erectile dysfunction in diabetes: a systematic review and meta-analysis of 145 studies. Diabet Med. 2017 Sep;34(9):1185-1192. doi: 10.1111/dme.13403. Epub 2017 Jul 18. PMID: 28722225.
- https://asmbs.org/resources/type-2-diabetes-and-metabolic-surgery-fact-sheet/
- https://www.frontiersin.org/journals/endocrinology/articles/10.3389/fendo.2023.1161521/full
- HoJin Shin, Sebastian Schneeweiss, Robert J. Glynn, Elisabetta Patorno; Trends in First-Line Glucose-Lowering Drug Use in Adults With Type 2 Diabetes in Light of Emerging Evidence for SGLT-2i and GLP-1RA. Diabetes Care 1 August 2021; 44 (8): 1774–1782. https://doi.org/10.2337/dc20-2926
- Bidulka P, Lugo-Palacios D G, Carroll O, O’Neill S, Adler A I, Basu A et al. Comparative effectiveness of second line oral antidiabetic treatments among people with type 2 diabetes mellitus: emulation of a target trial using routinely collected health data BMJ 2024; 385 :e077097 doi:10.1136/bmj-2023-077097
- Park J, Kim G, Kim BS, Han KD, Kwon SY, Park SH, Lee YB, Jin SM, Kim JH. Insulin Fact Sheet in Type 1 and 2 Diabetes Mellitus and Trends of Antidiabetic Medication Use in Insulin Users with Type 2 Diabetes Mellitus: 2002 to 2019. Diabetes Metab J. 2023;47(2):211-219.
- Howard-Thompson A, Khan M, Jones M, George CM. Type 2 Diabetes Mellitus: Outpatient Insulin Management. Am Fam Physician. 2018 Jan 1;97(1):29-37. PMID: 29365240.
- Rowley WR, Bezold C, Arikan Y, Byrne E, Krohe S. Diabetes 2030: Insights from Yesterday, Today, and Future Trends. Popul Health Manag. 2017 Feb;20(1):6-12. doi: 10.1089/pop.2015.0181. Epub 2016 Apr 28. PMID: 27124621; PMCID: PMC5278808.
- https://www.cam.ac.uk/research/news/type-2-diabetes-diagnosis-at-age-30-can-reduce-life-expectancy-by-up-to-14-years
- Kania, M., Mazur, K., Terlecki, M., Matejko, B., Hohendorff, J., Chaykivska, Z., Fiema, M., Kopka, M., Kostrzycka, M., Wilk, M., Klupa, T., Witek, P., Katra, B., Klocek, M., Rajzer, M., & Malecki, M. T. (2022). Characteristics, Mortality, and Clinical Outcomes of Hospitalized Patients with COVID-19 and Diabetes: A Reference Single-Center Cohort Study from Poland. International Journal of Endocrinology, 2023(1), 8700302. https://doi.org/10.1155/2023/8700302
- Huang AA, Huang SY. Diabetes is associated with increased risk of death in COVID-19 hospitalizations in Mexico 2020: A retrospective cohort study. Health Sci Rep. 2023 Jul 5;6(7):e1416. doi: 10.1002/hsr2.1416. PMID: 37415678; PMCID: PMC10320697.
- https://archive.cdc.gov/www_cdc_gov/diabetes/library/reports/reportcard/diabetes-and-covid19.html
- https://www.weforum.org/stories/2024/11/diabetes-silent-epidemic-world-health/
- https://www.cdc.gov/nchs/fastats/diabetes.htm
- https://www.healthdata.org/news-events/insights-blog/global-diabetes-cases-pace-soar-13-billion-people-next-3
Article Update History
Updated on 30 May, 2026 (Current Version)
Created on 8 April, 2025
Explore More

Insulin Overdose: What To Do If You Take Too Much Insulin
Insulin is a vital hormone used to regulate blood sugar (glucose) in the body; however, taking too much insulin can be dangerous. Insulin is ...